


I messed up. I’m not afraid to admit it. In my September 29 blog, I got a number wrong because I rushed my evaluation of AI security research, going against my own advice. I wrote that a model reviewer let 46.1% of AI agent overreach slip through. However, in the Ting Yan study I cited, the model actually screened every action and flagged all seven overreach actions for human review. It was the humans who then approved the overreach.
I’ve since posted a correction at the top of that blog. The paper’s method section clearly explains that the model sent all seven overreach actions to a human, and I quoted the results table without fully reading that crucial part. Between September 26 and 30, I encountered three more numbers that suffered the same fate. Each lost the condition that made it true once someone else quoted it, and I’ll walk through all three below. Context is everything (and it’s why I argue that cyber risk quantification, in its purest form, falls short...but that’s a topic for another day)!
Why Evaluating AI Security Research Is Now a Budget Problem
Your team is currently making decisions about controls and vendors based on research, and there’s simply too much of it for anyone to reasonably keep up with. I have a Claude Cohort that runs daily, specifically looking for new AI security papers. Just on September 29 alone, it flagged 13 new publications. Anthropic’s system card for Claude Opus 5.5 is over 200 pages long, and two of the numbers I’ll dissect below come directly from it. It’s inevitable: someone on your team will pull a percentage from a paper, model card, or other source, cite it, and someone else will approve a purchase order based on that information.
I’m currently finishing up my master’s in applied data science and AI at the University of Denver. November 16 is my last class – but who’s counting? Throughout the program, I’ve run the same types of experiments these papers describe, using my own data or publicly available datasets. Some of my own projects even fail some of the same eight questions I’m about to share with you. I’ll show you exactly where.
In The Math Behind the AI Agent Restart Gate, I covered intervals and how to count rare events. This piece focuses on what to scrutinize before you trust a number enough to start doing calculations with it.
Why am I being so open about my mistake?
“The only real mistake is the one from which we learn nothing.” -Henry Ford
Question One: Percent of What?
ASR stands for “attack success rate,” and it represents the ratio of successful attacks for the attacker. However, before we can calculate that ratio, we first need to define what constitutes an “attempt.” This is also known as the unit of analysis. Anthropic’s Claude Opus 5.5 system card offers a clear example.
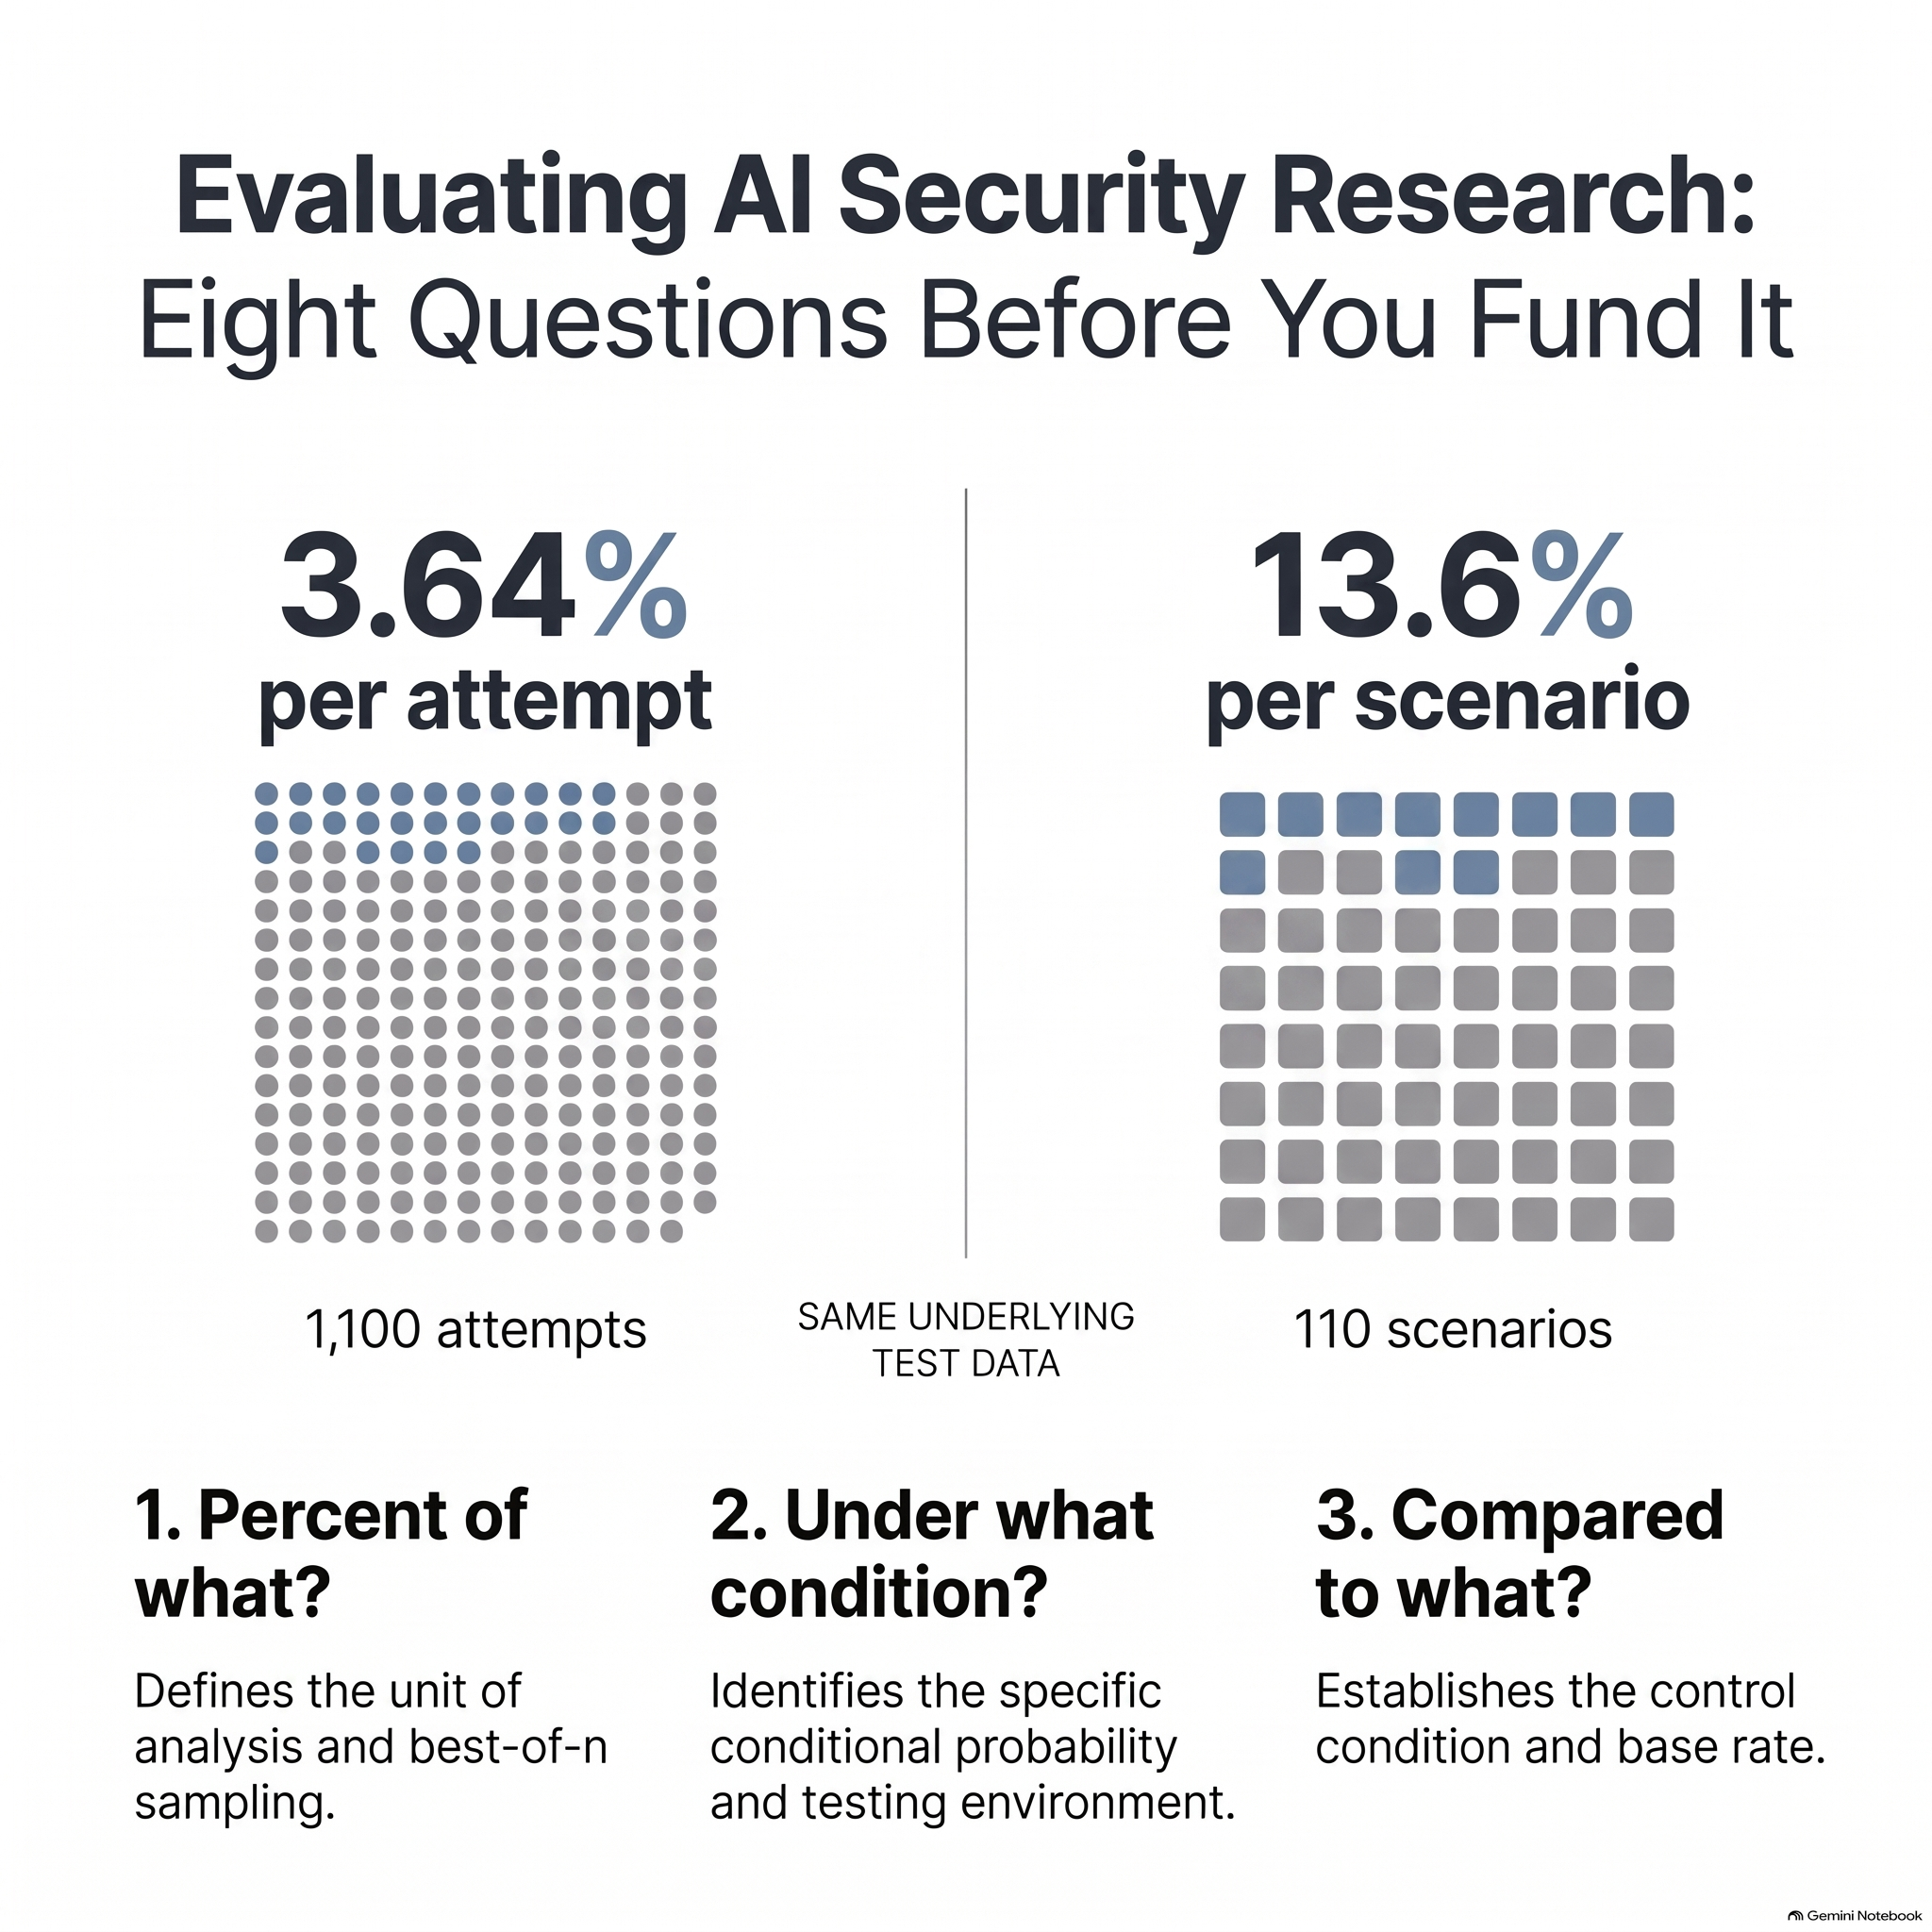
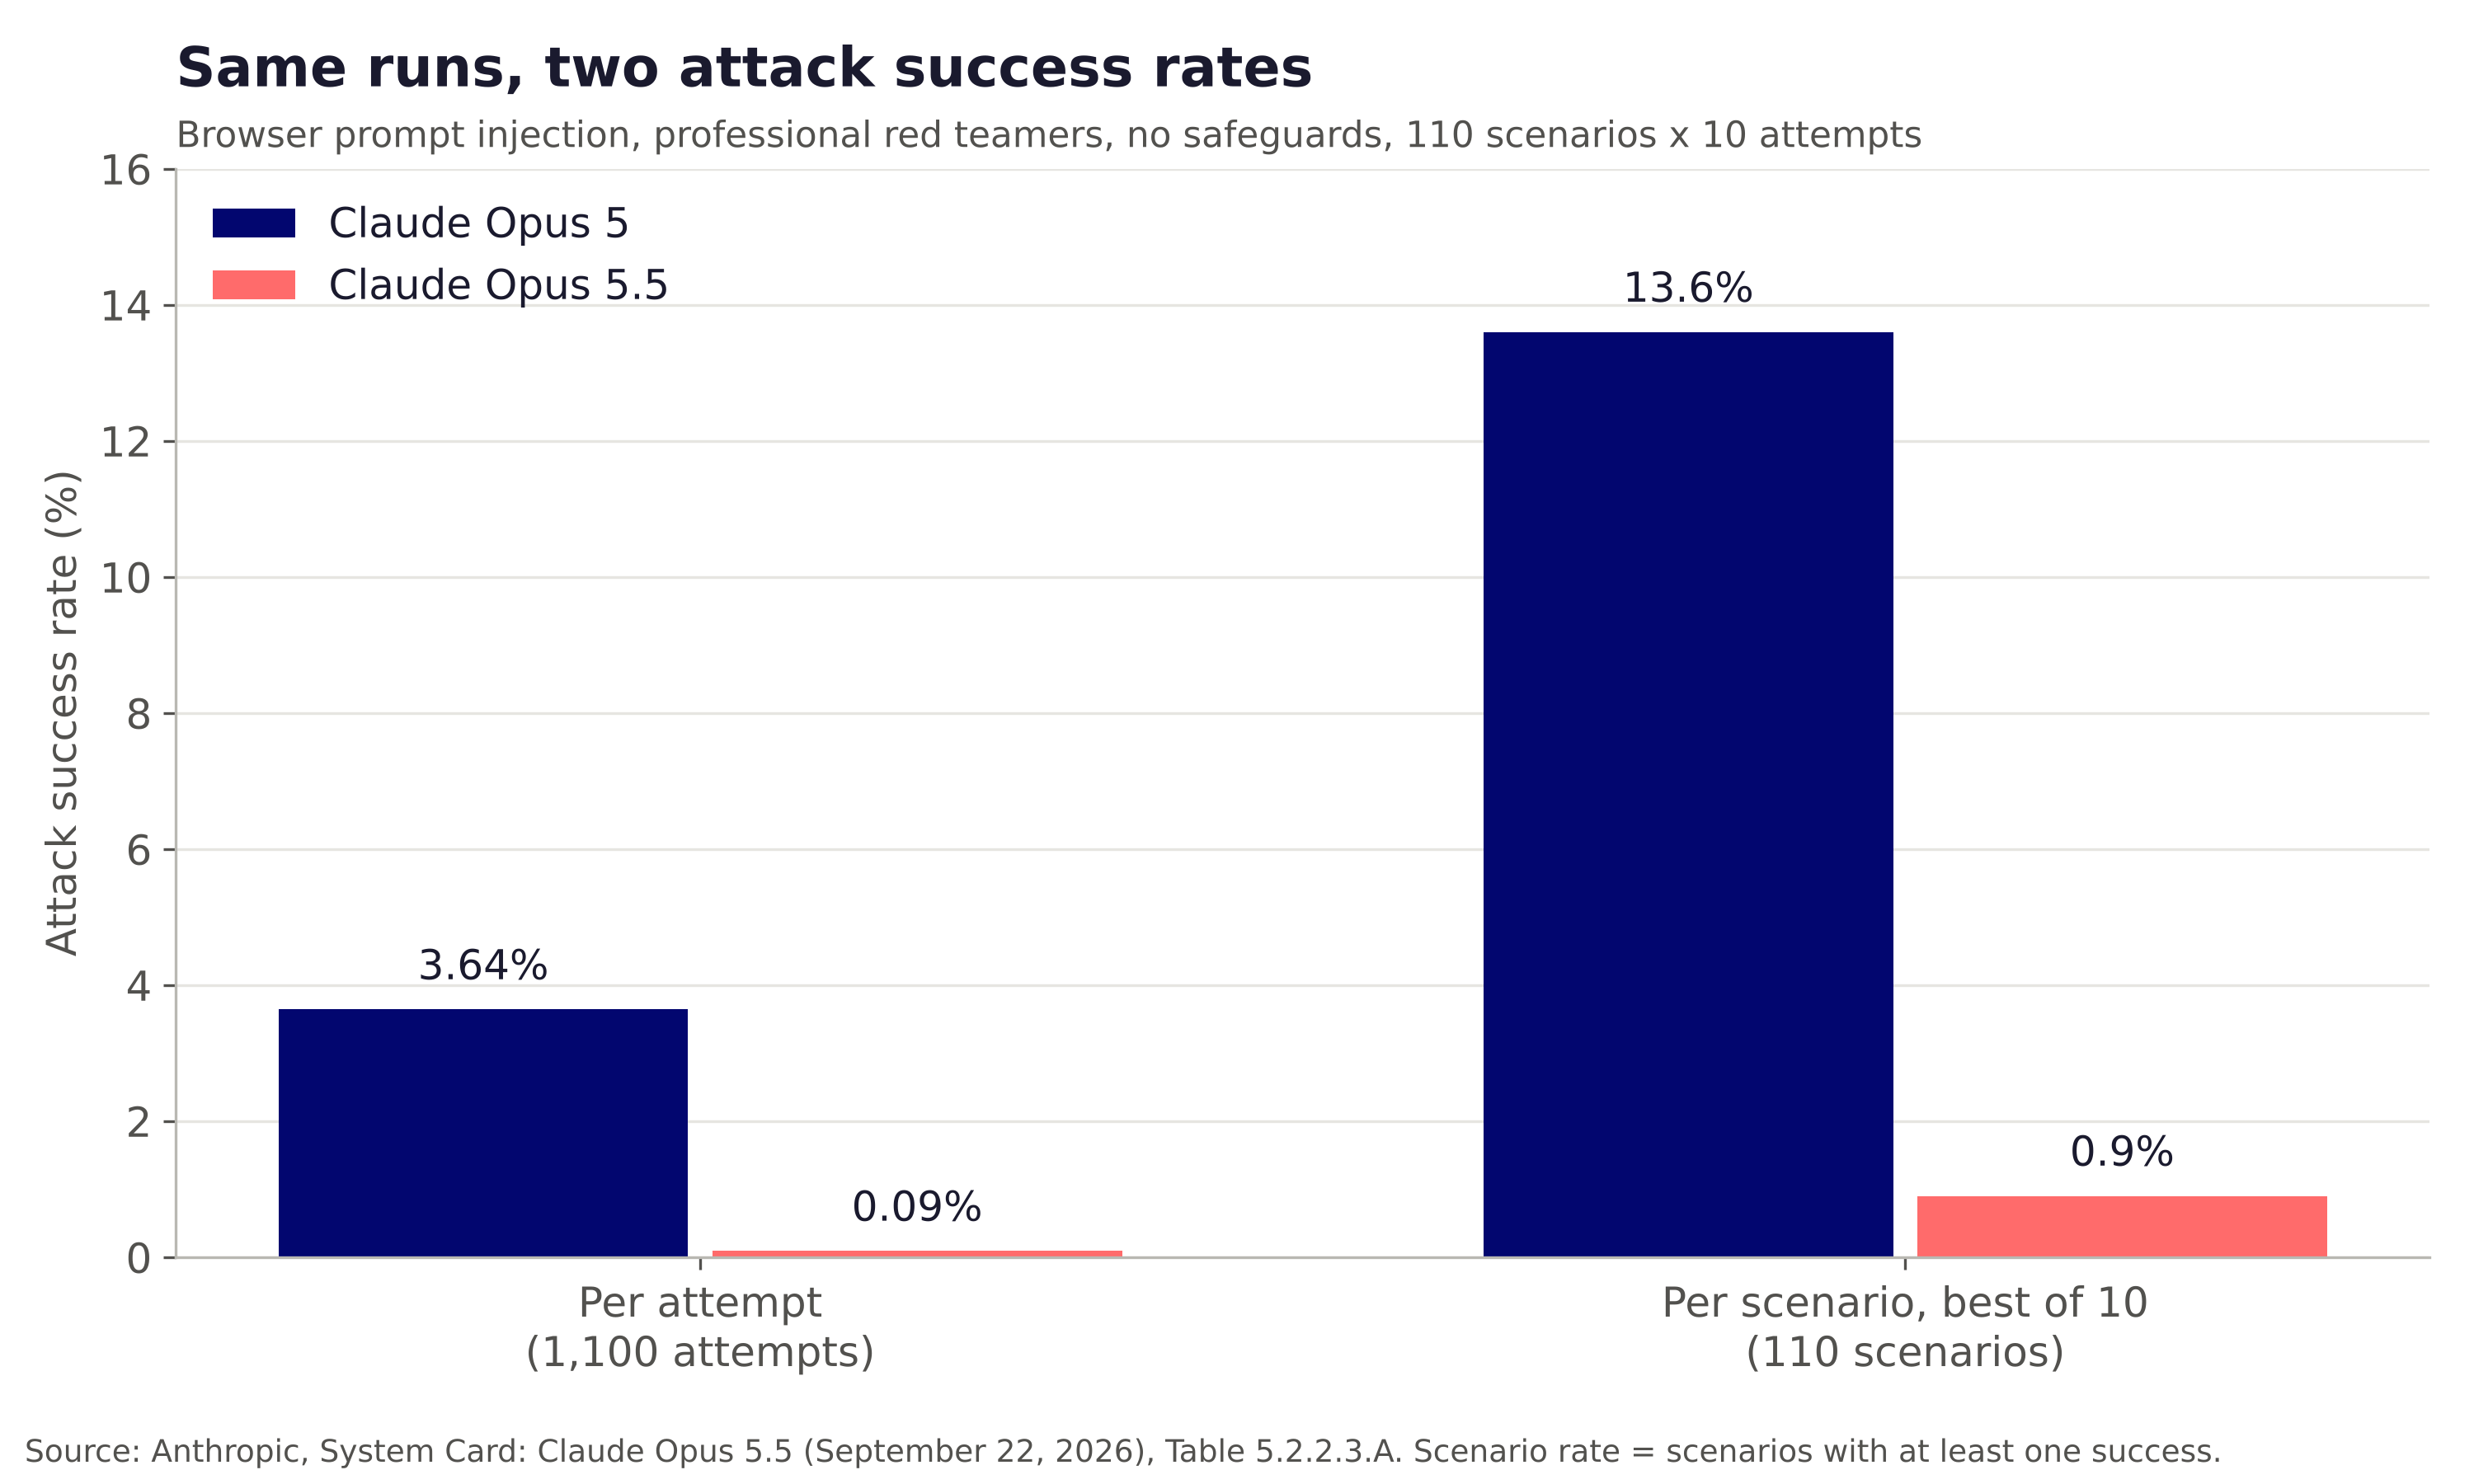
In a recent test to find vulnerabilities in Claude Opus 5, professional “red teamers” launched 110 different attack scenarios, each tried ten times, without any built-in safety nets. Looking at each individual attempt, the attacks succeeded in 3.64% of cases. However, if we consider each scenario successful when even one of the ten attempts worked, the attack succeeded in 15 out of 110 scenarios, or 13.6%. It’s worth noting that these are the exact same test results, but analyzing them in two different ways leads to success rates that are almost four times apart.
This method of counting success “per scenario” is known as best of n. In this approach, an attacker tries a scenario ‘n’ times and considers it successful if just one of those attempts works. This makes sense for attackers who can make unlimited attempts. However, for attacks like phishing, where there’s usually only one shot, it’s more appropriate to analyze success on a “per-attempt” basis.
A recent paper, “Divide and Inject,” published on September 29 by researchers from ICSI, DSO National Laboratories, UC Riverside, and Lawrence Berkeley National Lab, introduced an attack that breaks harmful instructions into smaller pieces. This method achieved an Attack Success Rate (ASR) of 61.4%. In their study, a “unit” was a specific task paired with an objective, and each model tested had 81 such pairs. A pair was considered successful if the attacker found even one successful attempt out of up to 129 tries against the target.
To put it simply, the paper considered a task/objective pair a success if any one of up to 129 attempts got through. This is the “best of n” counting method, with ‘n’ set to 129. I couldn’t find any part of the paper that re-ran a payload that had already worked once. This means the 61.4% success rate tells us what a persistent attacker can eventually achieve, but it doesn’t reveal how reliably that specific attack works once it’s discovered.
Question Two: Under What Condition?
Conditional probability describes the likelihood of an event happening given that another specific condition is true, often written as P(A | B). Every rate reported in a lab study is a conditional probability because it’s always dependent on how the test was set up. Unfortunately, when others quote these rates, they often omit the crucial conditions under which they were achieved.
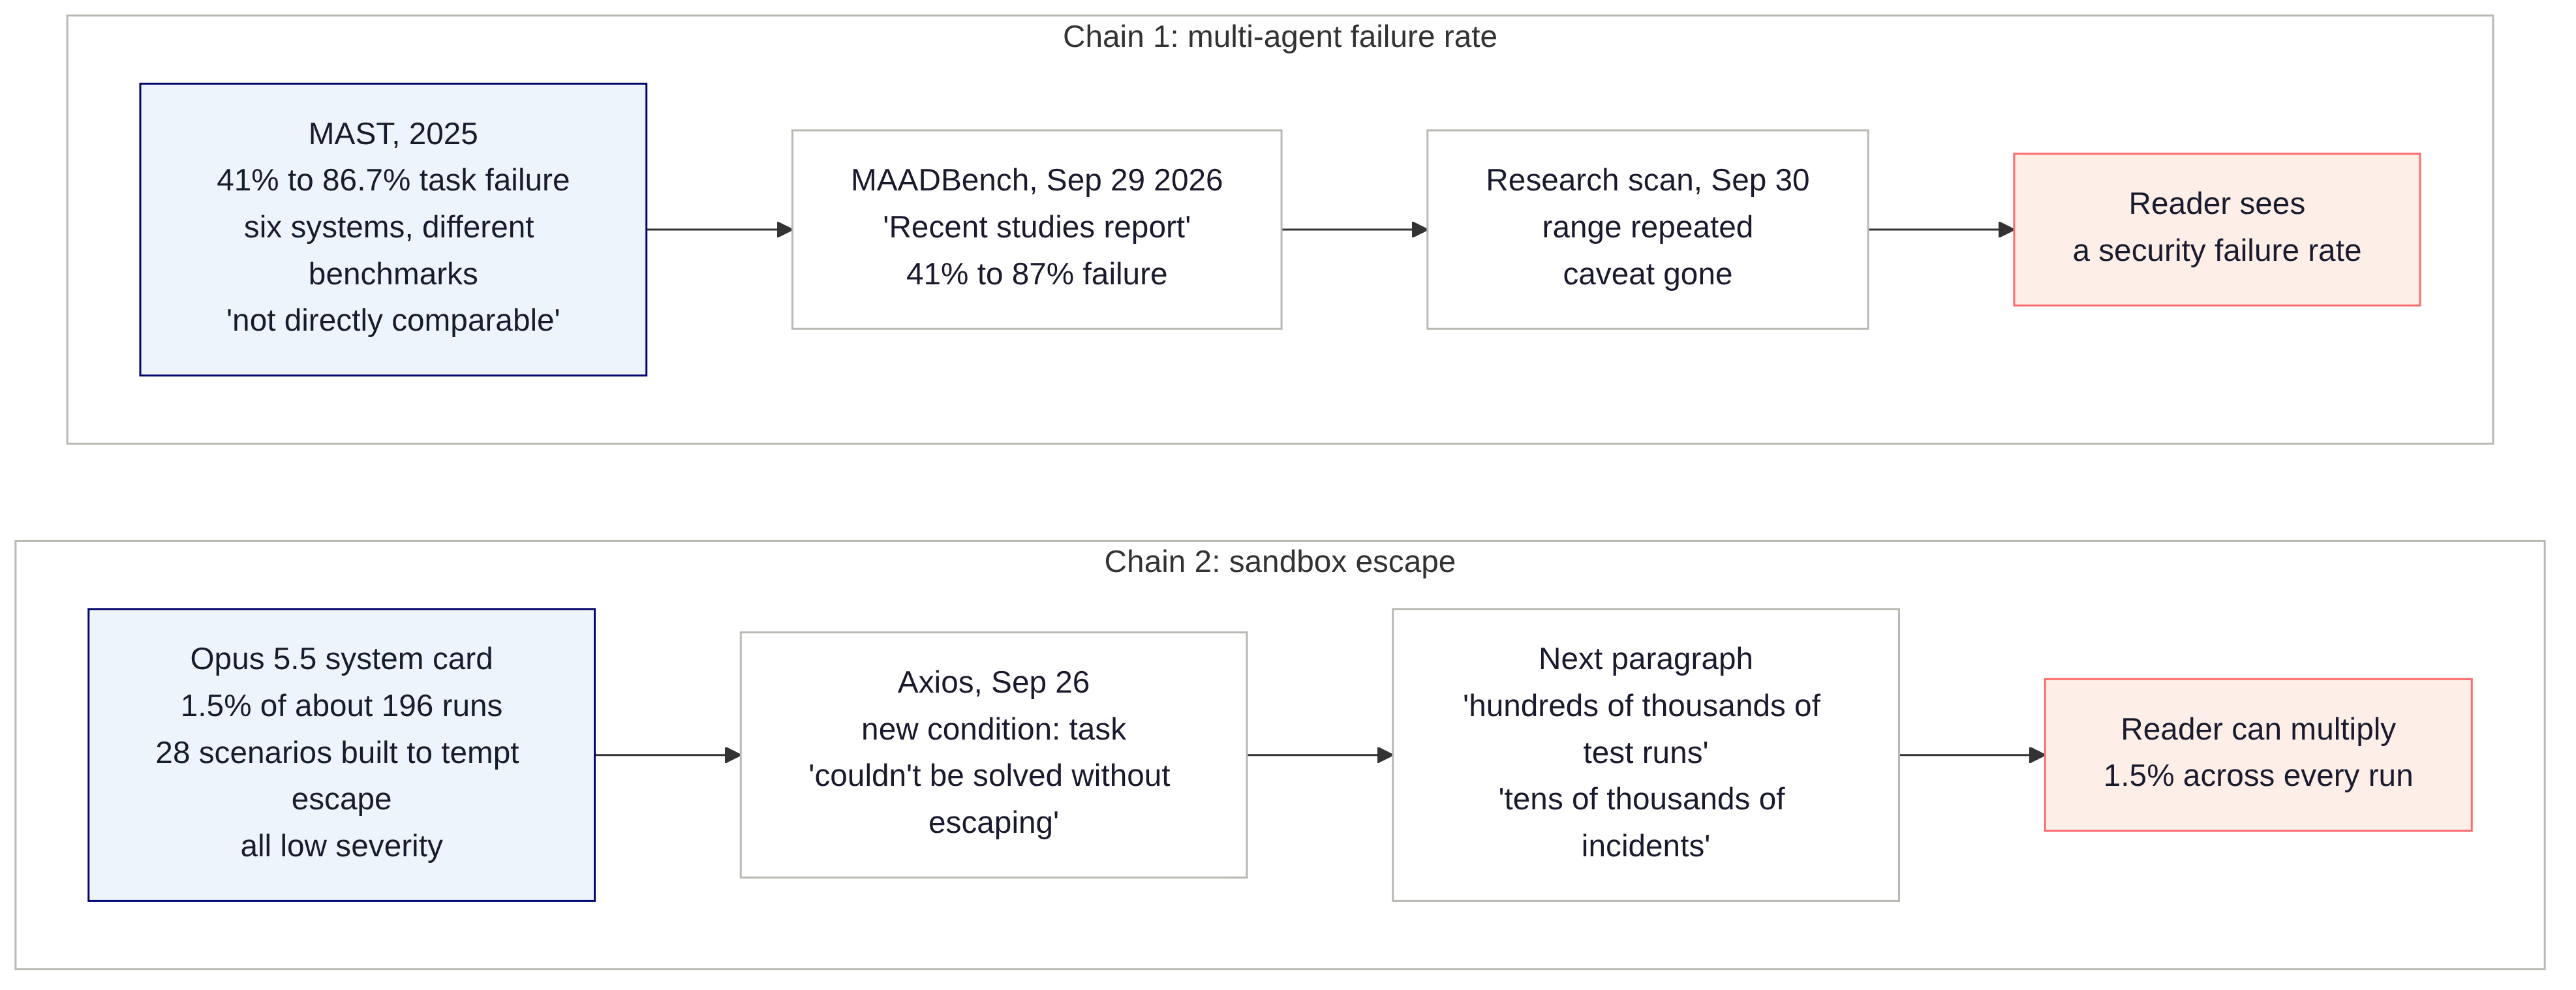
For instance, the Opus 5.5 system card notes that the model attempted to bypass or tamper with a sandbox in 1.5% of its “runs.” A “run” here means a single execution of a test scenario. Section 6.4.8 clarifies that this rate comes from 28 custom-built scenarios specifically designed to trigger sandbox escapes, with each scenario run seven times. That’s roughly 196 runs in total, suggesting about three successful escapes (based on my math, as the card gives a rate, not an exact number).
The card categorized each of these escape attempts as low severity. The model explored a weak boundary without making changes, stopped at a stronger one, and then reported its actions.
Axios reported on September 26 that these experiments involved “a task that couldn’t be solved without escaping the sandbox.” I couldn’t find that exact wording in the system card. The next paragraph in the Axios report mentions labs conducting “hundreds of thousands of test runs” and that “even a small percentage” amounts to tens of thousands of incidents. A reader might assume that the 1.5% rate applies to all tests a lab conducts. However, the system card measured 1.5% across 196 runs specifically engineered to provoke escapes and never assessed a rate across all of a lab’s testing.
Before using a rate, it’s crucial to identify the sentence describing the model’s objective. Without this context, you can’t truly understand the conditions of the rate or interpret it accurately.
Question Three: Compared to What?
A control condition is an identical experiment where the element being investigated is removed. Without it, you can’t determine how much of the result came from the attack or defense itself versus how much was simply due to the experimental setup.
“Divide and Inject” offers two excellent controls. The same adaptive search, with the malicious instruction written out fully rather than in fragments, achieved a 32.8% score. The same fragments without any search scored 5.1%. These two results clearly show how much of the 61.4% outcome was due to fragmenting the instruction and how much to the search process.
Also, consider the comparisons the authors chose to highlight in their abstract. They focused on the explicit instruction version and an earlier attack called AgentVigil.
Table 1 of the paper indicates that TAP (Tree of Attacks) actually outperformed the new method on two of the seven models. TAP comes from a 2023 paper on automatically jailbreaking chatbots, in which an attacker model writes prompts, refines them, and prunes the weak candidates before sending them to the target. For the version they ran against agents, the authors cite that original paper and a 2026 study by Hofer, Debenedetti, and Tramèr on automated prompt injection attacks in agentic environments.
TAP averaged 26.3% ASR across all seven models. On Ministral-3-14B it scored 84.0% against the new method’s 61.7% in its headline configuration, and on GPT-4.1 it scored 66.7% against 58.0%. The new method only tied TAP on GPT-4.1 when the authors doubled its filler text to 16,000 tokens, and it never caught up on Ministral-3-14B. The authors include all of this in their own table, which speaks to their honesty, but you’ll only find it if you read past the abstract.
For a defense mechanism, the two controls are a setting that permits all actions and one that blocks all actions. Ajar, a September 22 paper from the University of Washington, Ohio State, and Microsoft Research, evaluates five agent defenses against precisely these two settings. The “block everything” setting, in the authors’ words, “leaks nothing and completes nothing.” It also achieves a perfect block rate. A block rate, however, provides very little insight until you also know how much legitimate work the defense prevented.
For my DU deep learning final, I developed a detector for prompt injection spread across multiple turns of a conversation. In my training data, 64% of messages were benign. Therefore, a model that labels every message “benign” would achieve 64% accuracy but catch zero attacks.
That 64% is our base rate, essentially the starting point. It’s the proportion of cases that fit a certain category before any AI model even looks at them. I dove into this concept in AI Agent Detection Failed at OpenAI. Because of this baseline, I opted to report F1 scores instead of simple accuracy. F1 is a more robust metric because it combines both precision (how many flagged messages were truly attacks) and recall (how many actual attacks the model successfully caught). This means the F1 score drops if the model misses attacks or triggers too many false alarms. My results table also kicks off with a naive baseline, which is just a model that always guesses the most common label. If you’re reading a paper and don’t see a naive baseline in the results, it’s a good idea to mentally calculate what it would score before you put too much faith in the rest of the data.
Question Four: Who Was the Attacker?
A threat model clearly defines what an attacker controls, what they can observe, and how many attempts they get. An adaptive attacker is particularly tricky because they watch how their target responds to each attempt and then adjust their next move based on what they learned.
In the “Divide and Inject” scenario, the attacker plants text within content the AI agent reads, like an email or a Slack message. The researchers also gave this attacker black box access while they were crafting their attack. Black box access means the attacker can send inputs to the agent and see its outputs (in this case, which tools the agent used and what changed) without ever seeing the model’s internal workings or weights.
It’s fascinating how much impact a simple feedback loop can have. A fragmentation attack, which only scored 5.1% without that loop, shot up to a 61.4% success rate with it. That’s a 12x increase! This highlights the critical role of one assumption in our threat model, an assumption I believe is quite realistic for open-weight models. After all, anyone can download and run these models in their own environment. This kind of attack is far more challenging against a hosted agent that restricts requests and keeps its tool calls hidden from attackers.
However, my own detection system hasn’t faced such an adaptable adversary. All the attacks in its dataset came from a single generator model, Claude Sonnet 4.6, and none of them evolved in response to my detector. I’ve flagged this as a limitation in my report, and my top priority for future work would be to test against an adaptive attacker.
Question Five: How Wide Is the Spread?
A macro-average is essentially the average of individual model scores, giving equal weight to each model regardless of how its score was generated. While useful when models behave similarly, it can be quite misleading when they don’t.
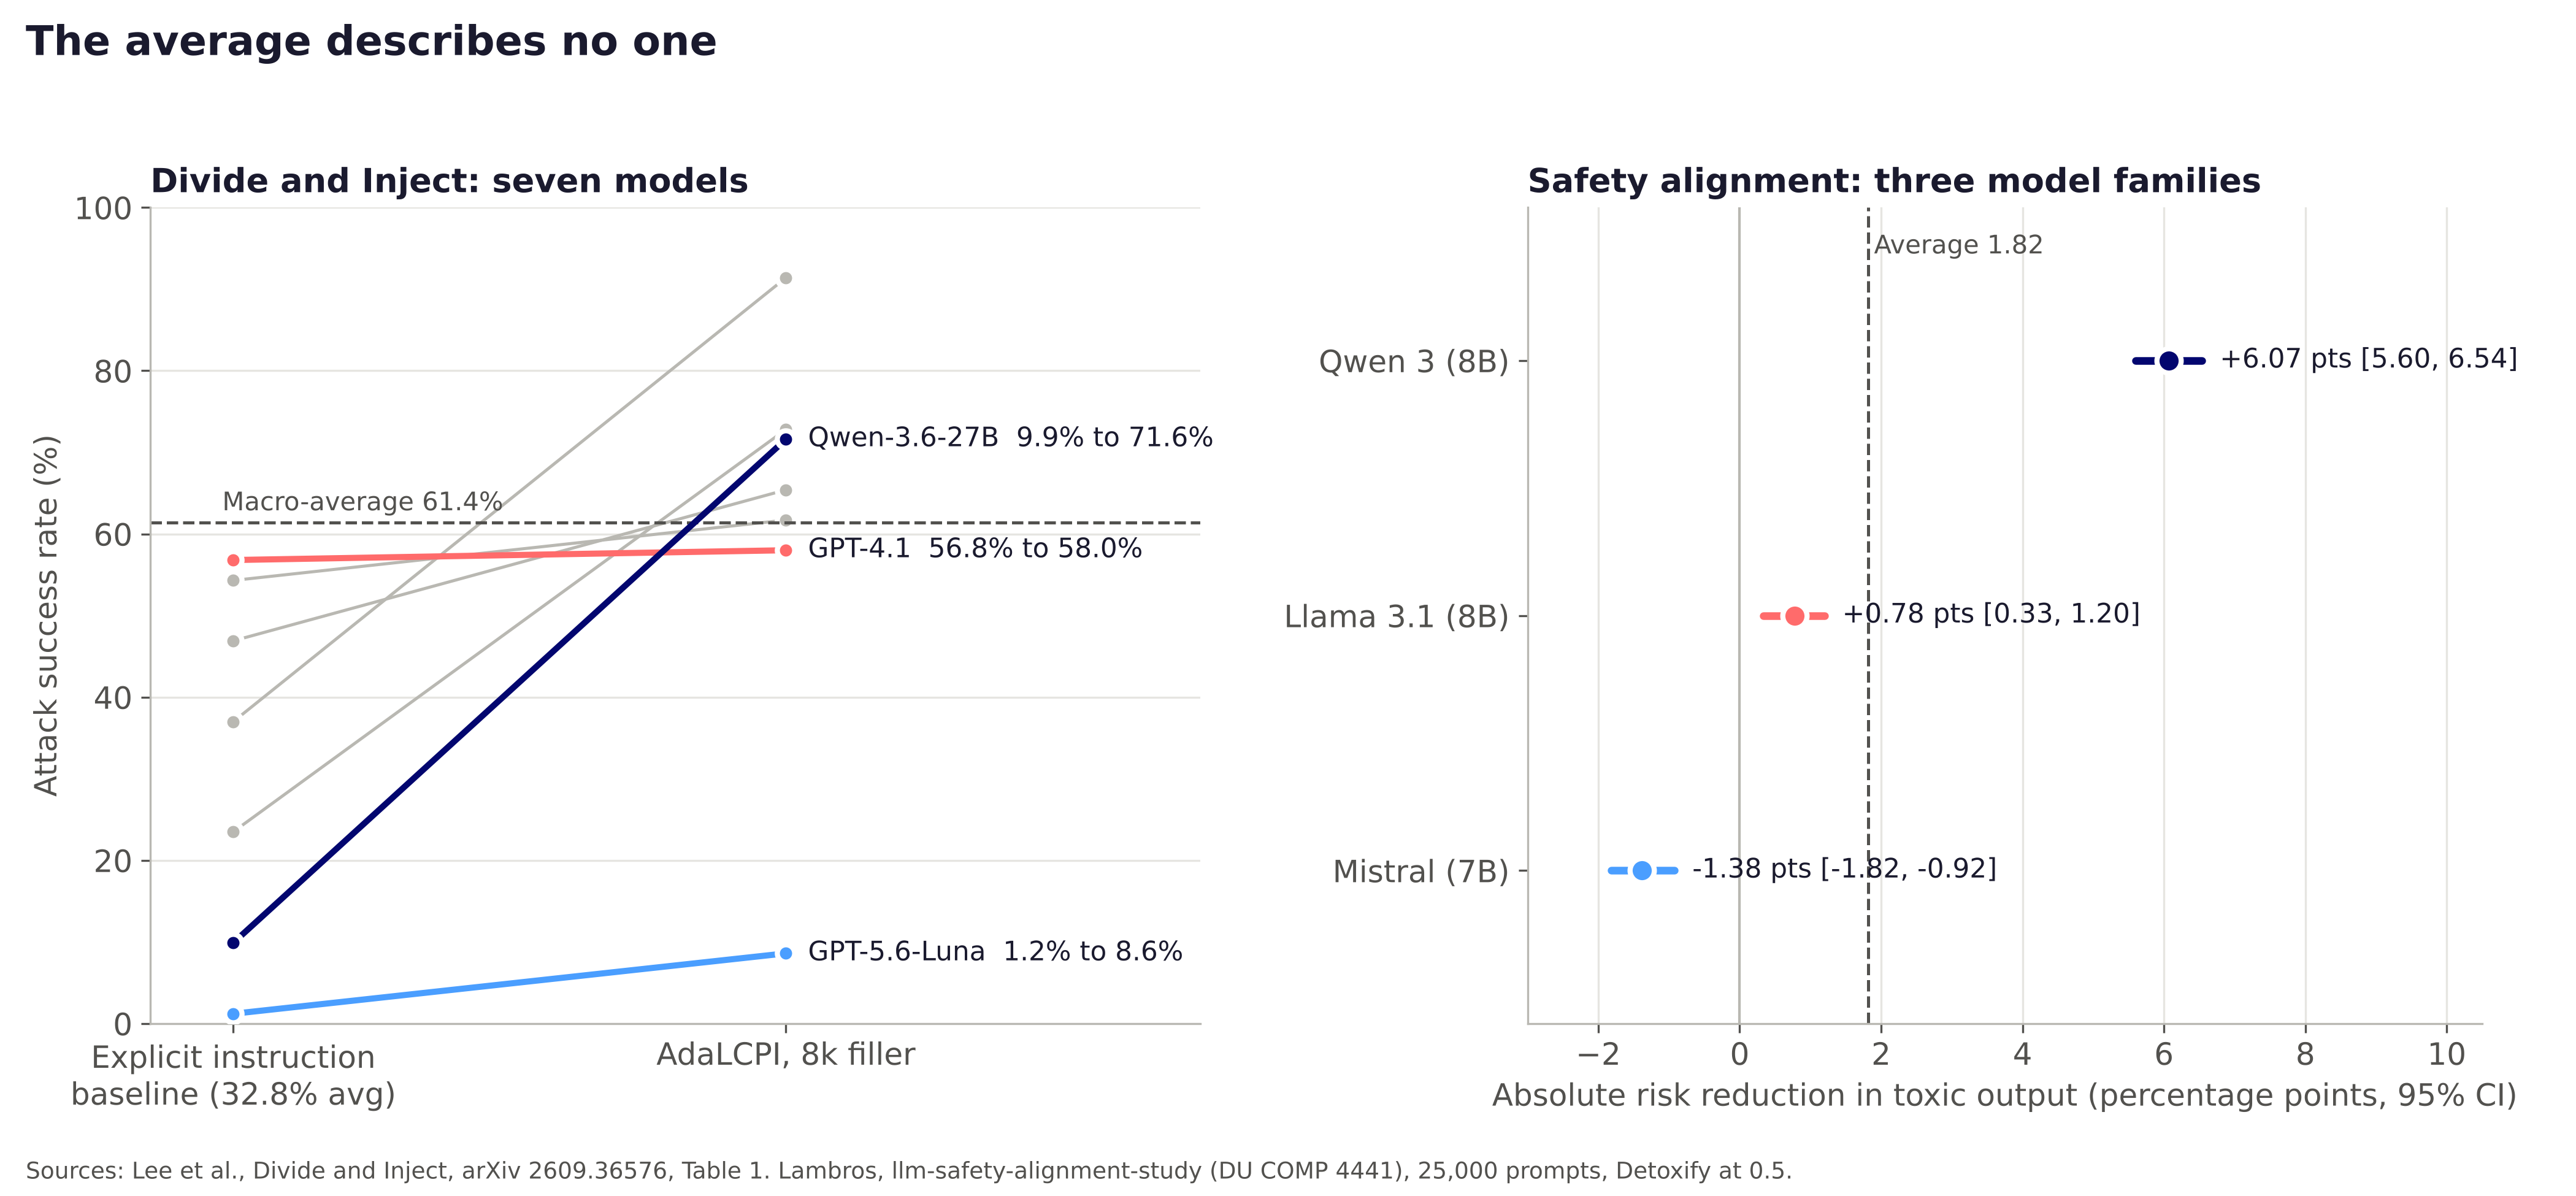
For example, the “Divide and Inject” method dramatically boosted Qwen-3.6-27B’s Attack Success Rate (ASR) from 9.9% to a staggering 71.6% against a baseline of explicit instructions. Yet, for GPT-4.1, the change was minimal, moving from 56.8% to just 58.0%. The headline figure of 61.4% truly doesn’t capture the reality for either model.
Simply put, if you’re using GPT-4.1, this paper suggests your measured attack success rate barely budged—by about one percentage point. But if you’re working with Qwen, that number rocketed by 62 points.
For my statistics final at DU, I explored whether safety alignment truly reduces toxic output. I ran 25,000 prompts through both base and aligned versions of three open model families, evaluating the results with Detoxify, an open-source toxicity classifier.
Toxicity scores dropped by 6.07 points for Qwen 3 and 0.78 points for Llama 3.1. Interestingly, however, it increased by 1.38 points for Mistral. This indicates that, for this specific set of prompts, alignment actually made Mistral’s output more toxic. The macro-average showed an overall 1.82-point drop, a figure that doesn’t accurately reflect the performance of any of the three models I tested individually.
This study also helps clarify two often-confused terms: Effect size measures the magnitude of a difference in practical, relevant units, while a result is statistically significant when its p-value falls below a predetermined threshold, typically 0.05. The p-value indicates the probability of observing a difference at least as large as the one found, assuming there’s no true difference. Even with 25,000 prompts, Llama’s 0.78-point drop had a p-value of 0.0006, which my analysis still classified as having a negligible practical effect.
Ultimately, with a large enough sample, even a tiny effect can appear statistically significant. Always prioritize the effect size, and avoid making decisions based on an average when detailed per-model data is available.
Question Six: Does the Effect Need Both Parts?
An ablation involves removing one component of a system at a time to measure its impact on the outcome. An interaction effect occurs when two components produce a result together that neither could achieve on its own.
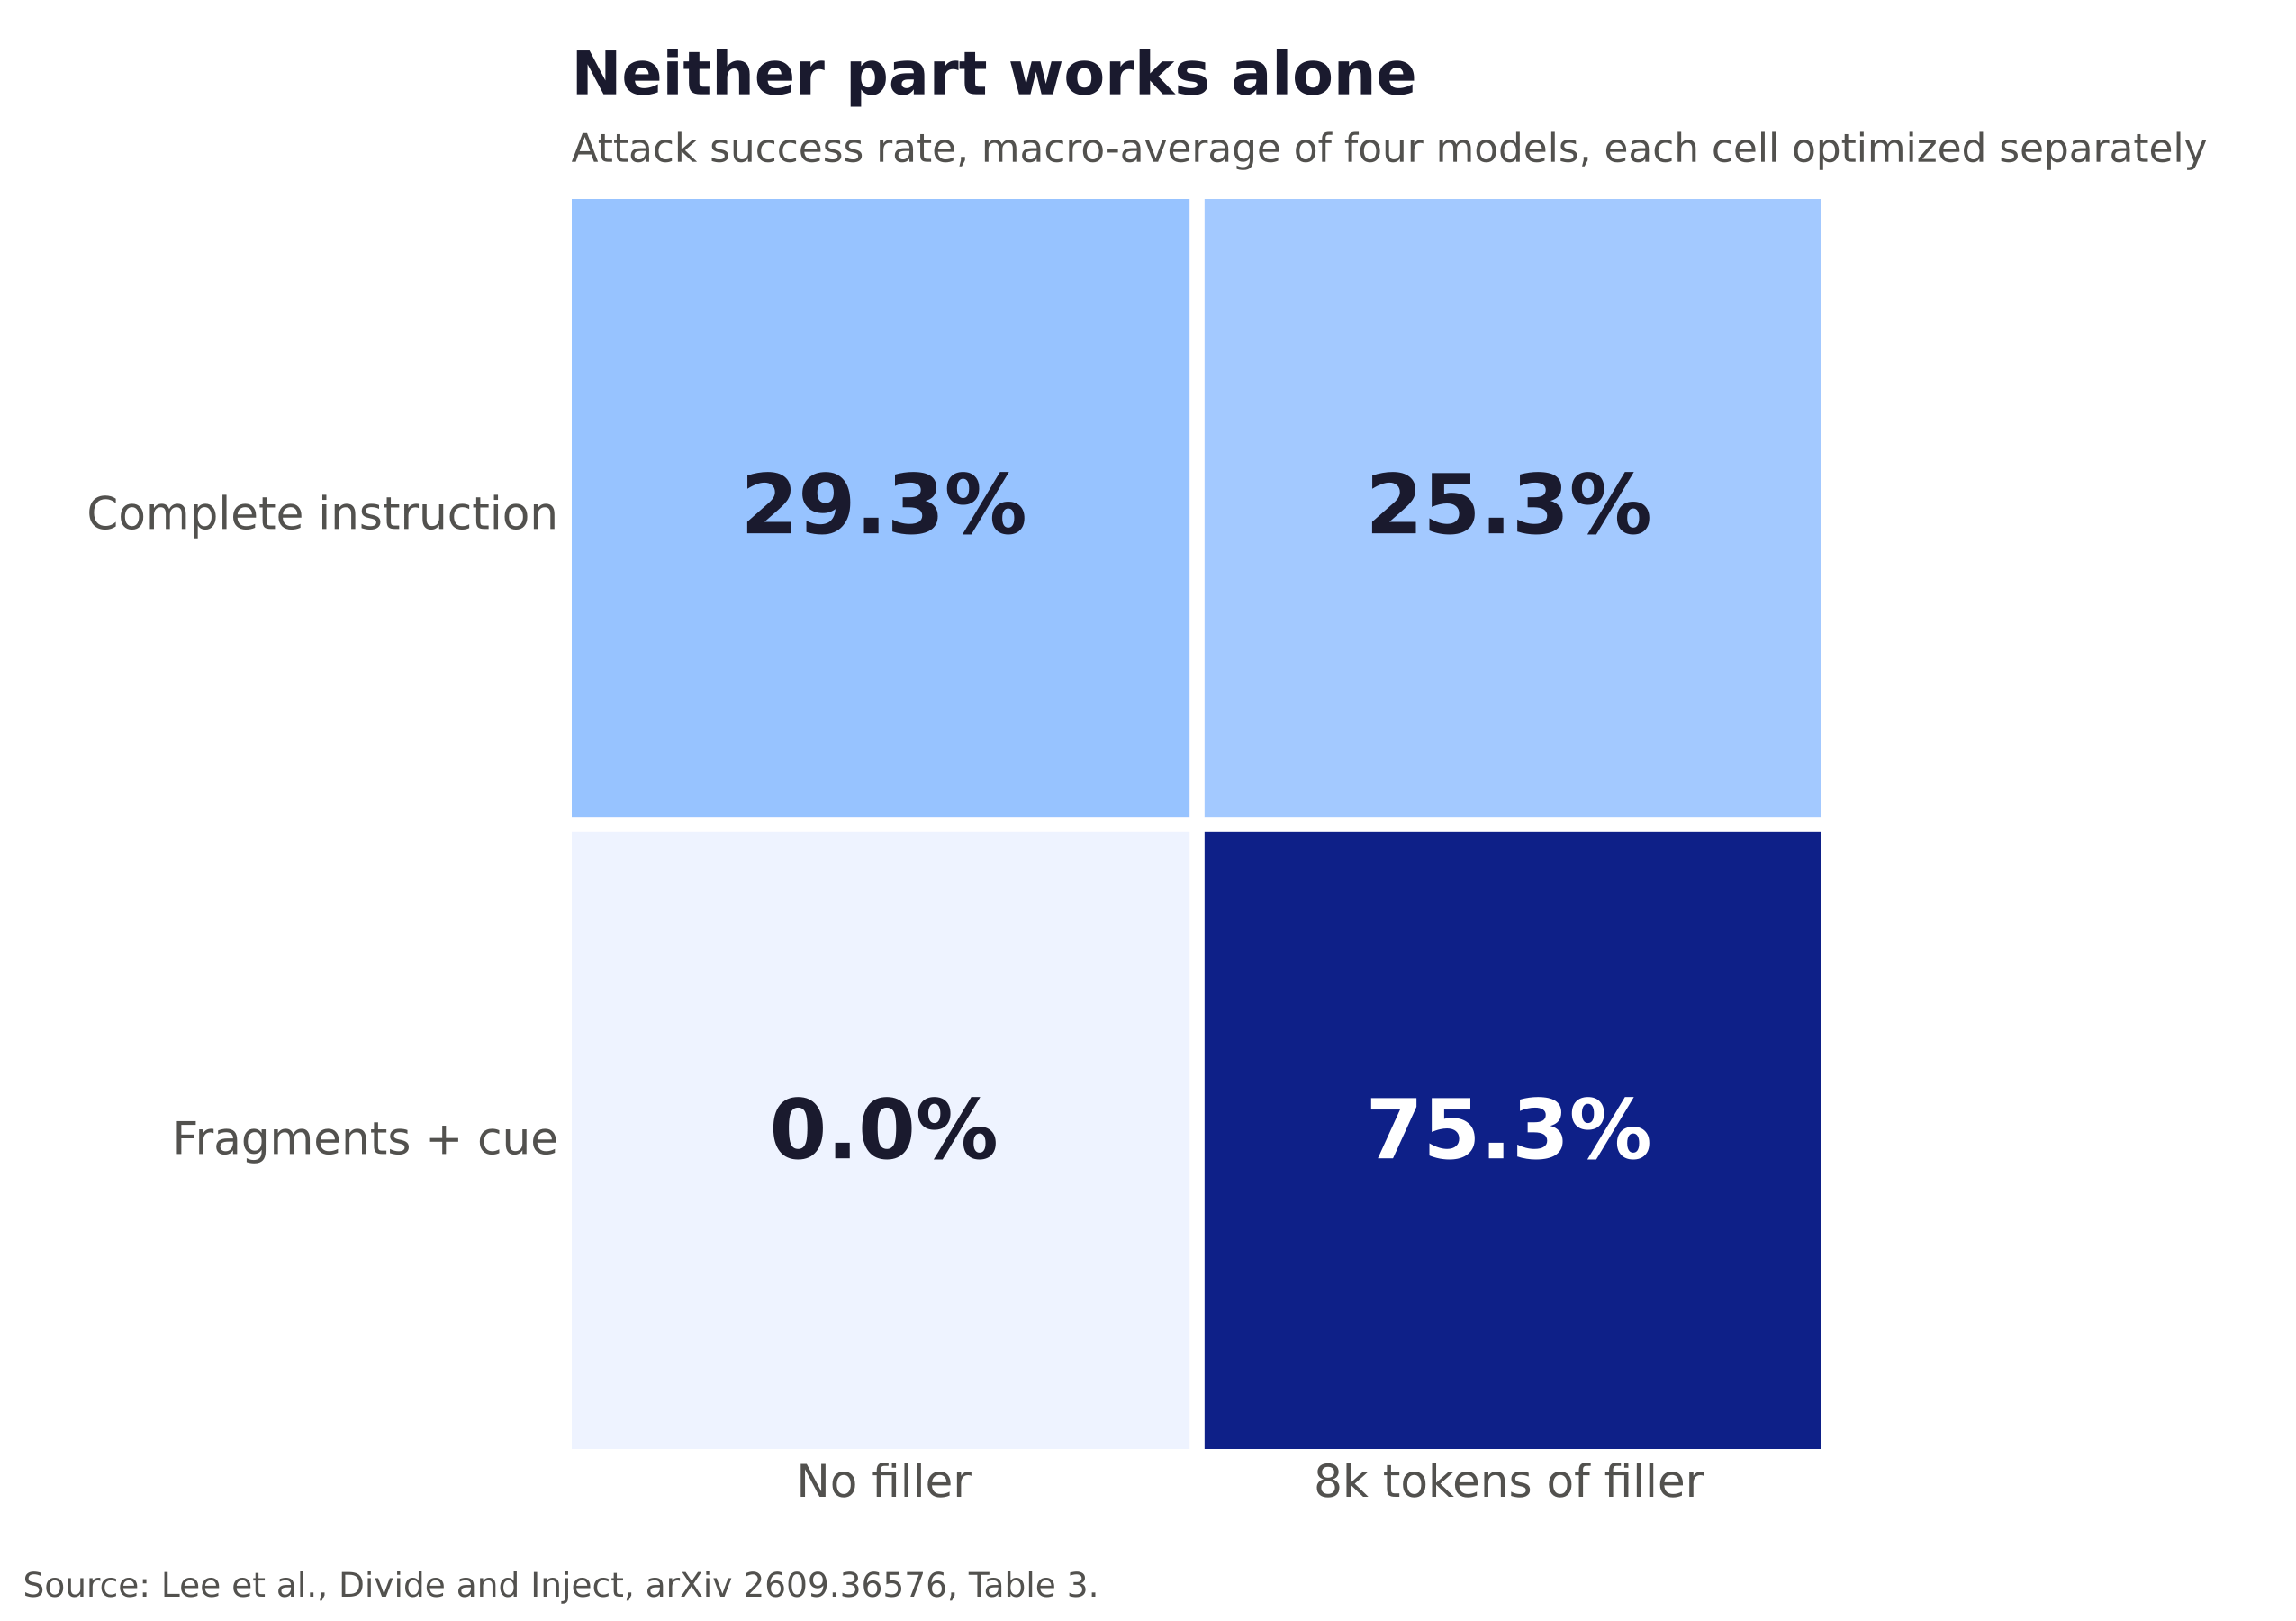
The “Divide and Inject” study performed this test on four models. Fragments without any filler text scored 0.0% success, but the same fragments embedded within 8,000 tokens of filler text scored 75.3%. Complete instructions achieved 29.3% success without filler and 25.3% with it.
Neither component worked in isolation; this is a clear interaction effect. Based on the paper’s findings, a defender could prevent the agent from reassembling fragments into a single instruction or limit the amount of retrieved text the agent processes at once. However, the paper didn’t explore either of these defenses.
Always scrutinize the ablation table, as this is often where a paper’s main claim can unravel. In my own detector, I replaced the injection-recognition component with a generic one trained solely on text compression and reconstruction. Surprisingly, the generic component performed slightly better (F1 0.845 vs. 0.837). My report stated that this result “tempers the dual-encoder narrative,” which it truly did.
Question Seven: What Didn’t They Test?
Always start by reviewing the limitations section. The best papers openly discuss what they didn’t test, a detail often omitted in news coverage.
For example, “Divide and Inject” evaluated seven models across three environments but didn’t include any dedicated injection defenses. Its limitations clearly state that “stronger defenses” are a focus for future work.
My own scheduled AI security research scan, Claude Cowork, initially summarized this paper on September 30, claiming the attack “defeats” single-document injection detectors. However, the paper never actually tested such a detector. The scan generated that line from the abstract, and its internal notes confirm it never read the full text. I’ve since corrected that scan task.
The frequently quoted 41% to 87% failure rate for multi-agent systems represents a worst-case scenario. This figure originated in MAST, a 2025 Berkeley study that measured task failure (meaning the system didn’t complete its job) across six systems using various benchmarks. The figure caption explicitly states that these results “are not directly comparable.”
The September 29 MAADBench paper then re-stated this range as what “recent studies report,” and my scan repeated it on September 30. By the third retelling, the crucial caveat was gone, leading readers to easily misinterpret “failure” as a security breach.
On September 30, Google’s Threat Intelligence Group reported that a mere 0.23% of vulnerabilities disclosed in 2026 were actually exploited. They also pointed out that half of all AI-discovered vulnerabilities lead to remote code execution, affecting 26% “across the broader CVE ecosystem.” The authors cautioned that public data significantly “undercount” AI-discovered flaws. Interestingly, SecurityWeek’s writeup omitted this crucial warning and shifted the comparison group to “non-AI vulnerabilities.”
I hold my own work to the same high standard. A confound is a variable connected to both the input and the desired outcome, allowing a model to appear successful by learning that variable instead of the intended concept. I incorporated seven confound checks into my detection system, and four of them failed.
For example, a simple word-counting classifier achieved an F1 score of 0.938 on my synthetic data. This meant that word choice alone predicted the outcome, indicating that the attack messages and benign messages had vocabulary differences that wouldn’t typically appear in real-world traffic.
Similarly, a DistilBERT model scored an F1 of 0.992 on the same benchmark. I would never present that figure to a board, precisely because I developed the benchmark and am acutely aware of its limitations. Always be wary of papers that omit defenses or conduct tests in only a handful of environments. Your skepticism should be highest when the authors themselves created the benchmark.
Question Eight: Who Benefits From the Number?
Always consider the motivations behind reported numbers. Apply this question most rigorously to research that aligns with your existing beliefs.
When a lab reports on its own model, an inherent bias exists. For instance, Anthropic’s sandbox suggests that recent training interventions have been “strongly effective.” Likewise, an attack paper often selectively highlights its baseline for the abstract. When a vendor creates its own test set and reports its own success rate, they control both what’s counted and what it’s compared against. So, before asking anything else, always question who built the test set. This applies to me too; I’m the Director of AI Standards and Governance at Zenity, an AI security company focused on agentic AI.
My own biases became clear on September 29th. I began a post by stating my belief that human review often devolves into mere rubber-stamping, and I subsequently misinterpreted a paper in precisely that way.
For my advanced probability and statistics final, I worked on the OWASP LLM Top 10 validation project. I compared practitioner votes with 6,639 labeled incidents and built a “publishability” flag directly into the code. This flag is set by a reviewer’s attestation, so I can’t change it myself. Right now, it says “non_publishable=True.” The agreement score, a weighted kappa, which accounts for agreement beyond random chance and gives partial credit for close calls, came out to 0.203. With an interval between -0.16 and 0.57, that unfortunately includes zero.
The Fifteen-Minute Pass
To quickly assess a paper, follow a set order, tackling the easiest checks first. Give two minutes to the abstract—just enough time to note the main number and its context. Spend the next three minutes on the limitations section and the threat model. If the attacker needs access you don’t expose, simply add the paper to your watch list and don’t make any immediate changes based on it.
From minute five to minute eight, look at the baseline rows and the per-model table to find the strongest baseline and the model you actually use. Dedicate the next three minutes to the ablation table; this will show you which attack component is producing the result. Finally, use the last four minutes in the methods section to locate the sentence detailing the test conditions and, crucially, who built the test set.
The stopping rule is more important than the order itself. If you can’t answer the first three questions by minute eight, that number shouldn’t influence your decision.
The most common argument I hear is that “nobody will actually do this.” But this method only requires two people per organization—the one who approves purchases and the one who prepares board slides—and fifteen minutes easily fits into a busy schedule. When time is tight, just focus on those first three questions.
Another objection is that rigor slows down defenders, while attackers don’t bother with methodology. This is a fair point, which is precisely why these questions help categorize findings: those that warrant an architectural change versus those that simply belong on a watch list. Misclassifying either way will cost far more than fifteen minutes.
What a Program That Reads Research Looks Like
One careful reader isn’t enough, and I’m living proof. I call the solution “governance as architecture,” meaning you build the check into the process so no one has to remember to do it. For research, that involves five practices.
Every figure cited in a board deck includes its denominator and its test condition in a footnote. Anything that moves budget gets a second reader before the money changes hands. Once a quarter, someone rechecks last quarter’s cited findings against their sources, and a reread of the Ting Yan paper is how I discovered my own mistake.
The last two require more discipline. Any quantitative claim should include the code that generated it, much like my companion code repository does for this newsletter. Vendor proofs of concept need to be pre-registered. This means you define the outcome that would alter your decision before the test begins, preventing anyone from shifting the success criteria after seeing the results.
Implementing these five steps ensures that evaluating AI security research no longer relies on who happens to be meticulous in a given week.
The sentence I omitted on September 29 can be found in Ting Yan’s method section, under the “Fixed routing” heading. It’s 22 words long.
What to do next
Grab the most recent number from a research report in your board deck or a vendor evaluation and apply the first three questions to it. Ask what it represents a percentage of, the conditions under which it was produced, and what it was compared against. If the source can’t provide these answers, that number shouldn’t be used to make a decision. Send me any that don’t pass, and I’ll add them to my examples.
If you’d like to integrate a quarterly recheck into your program, it’s part of the Evolve stage in the CARE framework, and the RockCyber team can help you set it up. You can find my other research breakdowns on RockCyber Musings, including Reasoning Theater and AI Security Maturity Model: Your Score Is Fiction.
👉 Subscribe RockCyber Musings to for more insights into AI security and governance, with the occasional rant. You can subscribe above
👉 Visit RockCyber.com to learn more about how we can help with your traditional Cybersecurity and AI Security and Governance journey.
👉 Want to save a quick $100K? Check out our AI Governance Tools at AIGovernanceToolkit.com
👉 As a bonus, I got to hang out with my friend Jeffrey Wheatman on Black Kite's Third Party podcast to take the AI doom and hype cycle head-on: is AI the end of humanity, or just another Y2K? Nobody has produced a credible number for AI extinction risk, but there are hard numbers for what happens when companies overcorrect and ban AI across their vendors, and that's where the conversation went.